Some Statistics / Robert Pearson
The following charts and accompanying discussion by Robert Pearson is taken from Bechamp or Pasteur?. The bulk of the text by Pearson is posted separately.

by E. Hume
and R. Pearson
In any discussion of the value of a remedy or preventative for any disease, actual statistics of the results that have followed the use of such remedy or preventative in the past should be of great value in judging it, especially when the trend over a long period of years can be charted graphically.
Hence it seems proper to consider what a chart showing the death rates both before and after the introduction of some of these biological treatments, might indicate; especially when the results can be compared with the general trend following other methods of treatment of more or less similar diseases.
For this reason, this chapter contains several charts showing the death rates of several diseases both before and after the use of biologicals, as well as some of the death-rates of similar diseases with and without the use of biologicals.
These give an astounding confirmation of our contention that all biologicals are not only utterly useless, but are actually very harmful, and we urge a careful study of the charts.
These charts, together with the information that follows, should convince even the most faithful followers of Pasteur that the so-called ‘germ theory’ and the use of any and all biologicals is, as Dr Hudson says, wrong, and should be completely abandoned immediately.
FIGURE 1
Smallpox and Vaccination In Leicester, England

Smallpox and vaccination in Leicester, England
Note how every increase in vaccination was followed by an increase in the smallpox death rate.
Note that in this chart during all the years that vaccination was actively pushed, through compulsory laws, etc., smallpox returned again and again, and usually after an increase in vaccination; culminating in the great epidemic of 1872. This came after a most intensive four year effort to completely vaccinate the population under a law (of 1867) that made refusal to submit to it a penal offense. And it came just after the supreme Medical Officer of England had announced that 97.5% of the population had either had smallpox or been vaccinated.
The worst epidemic came just when they had obtained the utmost in ‘protection’! Also note that since this time, while vaccination has dropped off in Leicester, smallpox deaths have also dropped off, and in this case to none!
While the public has so lost confidence in vaccination that less than 6% of all newborn children in Leicester for the past 20 years were vaccinated, there has not been one single death from smallpox in the last 33 years of the records, from 1905 to 1938 inclusive.
There is probably no city or country having compulsory vaccination in the world that can show a record like this.
This chart indicates that vaccination is not only not a preventative, but that is probably an active and important instigator of smallpox.
We might mention here that Dr R. Garrow, Medical Officer of Health for Chesterfield, England, asks why it is that the case mortality rate from smallpox in all persons over the age of 15 in England and Wales for the years 1923-6 was five times as high in the vaccinated (0.3%), as in those who were unvaccinated (0.06%)! (He used official figures, and calculated only to one and two decimals; when figured to four decimals the rates become 0.324% and .0578%, nearer six times, the ratio between them being 5.6055 to 1. Other years seem to lean the same way, but to a lower ratio.)
If serums and vaccines have any value, as the pus-doctors have promised for so many years, why is not the ratio the other way around?
The Vaccination Inquirer of London, England, says that in Brazil, where they have rigid compulsory vaccination laws, and most energetic compulsion, the death rate from smallpox per 100,000 population in Rio de Janeiro for 1913–1922, a 10 year period, was over 600 times as high as that of London, where opposition is strong and the exemption laws are widely used!
If these are only ‘accidents’ as the doctors undoubtedly will claim, they at least prove that vaccines are useless; but my contention is that the use of animal pus injections is the cause of the higher figures.
FIGURE 2
Smallpox and Vaccination in Japan

Death rates from various diseases in Japan
Note how the increases in vaccinations in 1897 and 1908 were followed by increases in tuberculosis, heart disease, pneumonia, etc.
As Japan has had the most intensive and thorough vaccination practice of any country, probably for the last 60 or 80 years, any bad effects that might be due to serum or other biologicals ought to be registered here more fully and plainly than in less serumized countries.
To get an idea as to what the effects of biologicals have been here, I have charted the death rates of several diseases in Japan for the period since 1885, from figures in the Annual Reports of the Statistical Bureau, filling in one or two gaps from the Japan Year Book, and have also charted the total number of vaccinations in each year.
Vaccination was introduced into Japan in 1849, and it is said that ‘the people eagerly adopted it’. The first vaccination law was passed in 1874 and compulsory laws were passed in 1876, 1885, and 1909, each being more stringent than the previous one.
Now, I understand, a baby must be vaccinated within 90 days of birth, and again during the second and tenth years. As there have been over 187,679,000 vaccinations in Japan between 1885 and 1928 inclusive, any injurious effects of vaccination should be fully apparent here.
In 1890 animal lymph was introduced, at which time the death rate from tuberculosis and other lung troubles began to climb, and increased almost continuously for 28 years. Note that the peak years of vaccination are all followed by a rising death rate in these troubles, and that these tend to drop off when the number of vaccinations has been reduced for some years.
One recent yearbook stated that the race was ‘degenerating’ because the mothers had become negligent(!) but I believe the use of serums is more likely to be the cause of any ‘degeneration’, as well as the present high death rates from tuberculosis, etc.
Note also that in recent years, with no smallpox scares and no extraordinary vaccinations, the death rates of all diseases charted have turned definitely downward as the total number of yearly vaccinations has come down. This lends additional support to our argument.
The editor of the Year Book died in the early 1930s, and later figures are not uniformly compiled, nor all available, hence the chart – made in 1931 – has not been brought up to date.
FIGURE 3
Vaccines and Tuberculosis at School Ages
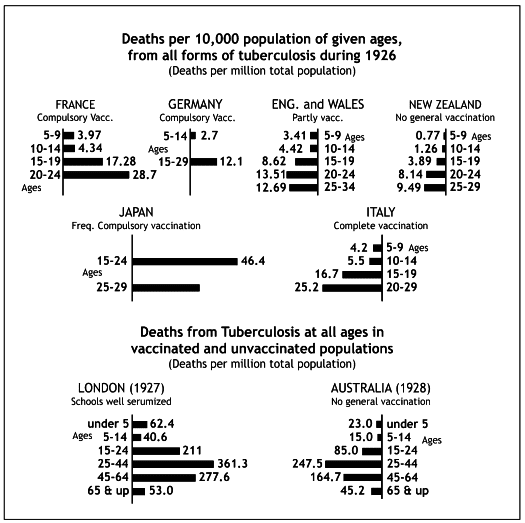
Vaccines and Tuberculosis at school ages
Note how much higher the death rate is in countries having compulsory vaccination, such as Japan and Italy, than in countries without compulsion, such as England, Wales, and New Zealand.
This chart bears out the view that biologicals can do the young no good. Note that the countries without any compulsory use of biologicals have the lowest death rates from tuberculosis among the young, while Japan stands at the opposite end, combining the most intensive compulsion known with the highest death rate.
FIGURE 4
Vaccines and other diseases
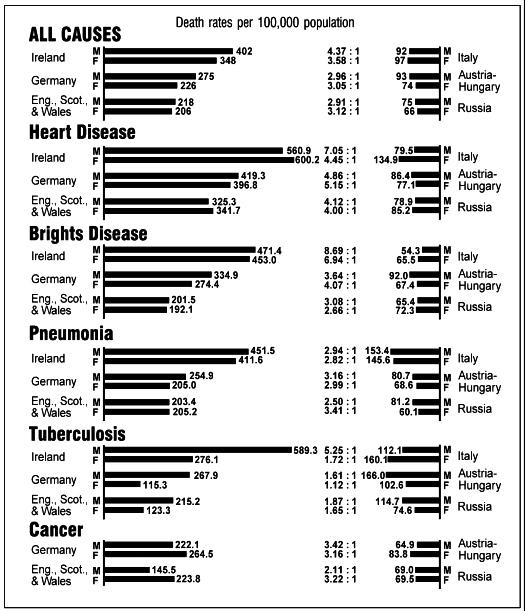
Mortality from highly fatal diseases among various groups of immigrants in New York State in 1910.
Note that much higher death rates prevail among migrants from countries having compulsory vaccination (on left side of the chart) than among immigrants from countries without compulsion (on the right side).
In the first three charts we showed that biologicals not only did not prevent smallpox, but on the contrary actually seemed to increase it, and furthermore, also increased tuberculosis in a substantial manner.
In Figure 4 we show that any kind of biological given for any one disease can have a most astonishing effect in increasing other diseases with which – if we believe the pus-doctors’ theories – it should have absolutely no connection.
The reader should read Chapter 7 and study Figures 2, 3 and 4 together to appreciate how true are the statements made in that chapter.
The statistics in Figure 4 are for all the foreign-born immigrants from the countries noted who were living in New York State in 1910. There were from 340,000 to 560,000 persons included in each national group, hence they should give a very reliable picture of the resistance to disease of the various groups.
Italy, as previously noted, had a compulsory vaccination law passed in 1888, but is included in the unvaccinated column because only a small percentage of these immigrants were subject to the law because of their age, and all of those were too young and too recently vaccinated for the bad effects to be fully developed by 1910, as explained on that page. Note, however, that all death rates in the Italian group average above those of the other two countries in the same column, with the single exception of Bright’s disease.
Note also that in tuberculosis, all groups except Italy have a much higher death rate among the men, large numbers of whom are probably vaccinated with considerable frequency in the armies, than among women, very few of whom (except nurses), were likely to be vaccinated so often. Is there a plausible explanation for all the differences that are shown in these figures, apart from vaccination?
FIGURE 5
Death rates from important diseases in the registration area of the United States

Death rates from important diseases in the United States.
Note how the death rates from cancer and heart disease, which are aggravated by biologicals, have increased while others have gone down.
As we saw in Figure 4 that serums seemed to increase other diseases, this chart was drawn to find the general trend in the United States.
Note the increase in heart disease and compare this with what we say in Chapter 7 and with Figures 4 and 6. Cancer and nephritis seem to have a similar trend, though less marked.
FIGURE 6
Diptheria, Scarlet Fever and Croup in England and Wales
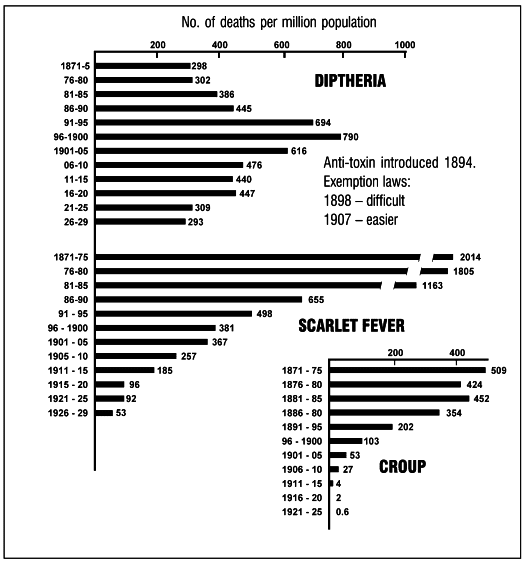
Diptheria, Scarlet Fever and Croup in England and Wales
Note how the diphtheria death rate was held up well above the 1871-80 death rate ever since antitoxin was introduced in 1893, while the death rates from scarlet fever and croup have consistently gone down at a rapid rate without the use of any biological.
Note that while scarlet fever and croup have had an enormous drop in death rate since 1871 without any serums being employed, diphtheria had a large increase. In fact, there was a real epidemic running from 1893 for about seven years, the period when anti-toxin was pushed the hardest! And the death rate for 1921–29 still averages above that of fifty years earlier!
In other words, with the ‘help’ of the anti-toxin to fight diphtheria, there is an increase in the death rate over 1871–89, while scarlet fever and croup have both had astonishing drops in mortality, over 96% and 99.8% respectively, without any anti-toxins to help.
There are official statements that anti-toxin was introduced into England in 1894, but it hardly seems possible that such a poisonous biological as this would be introduced and made compulsory on a national scale without any prior knowledge or experience with it whatever. For this reason, I believe that it was tried out experimentally in parts of England at least in 1893, or even earlier, and in this way the epidemic that started that year could have been started and kept going until the exemption laws reduced the number of customers.
The report of the Health Officer for Birmingham, England, for 1901 contains the following figure:
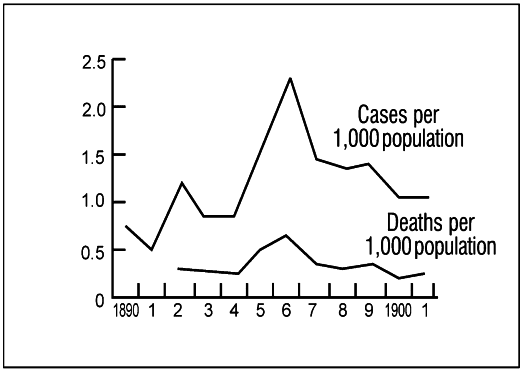
Diptheria in Birmingham, 1890-1901
From the report of the Health Officer for Birmingham, 1901.
There is no statement made as to when anti-toxin was introduced, but the rise in the death rate in 1895 would make me believe that it was in that year, and the Health Officer probably thought that this sudden increase at the time of the introduction of anti-toxin was merely a coincidence that was ‘just too bad’, and it might be best not to call attention to it.
Clearly, he believed in anti-toxin; when the drive to vaccinate every one passed its peak in 1897, he very quickly notes that the case mortality rate in diphtheria averaged 25% from January to June (when school let out) and only 20% from July to December. This 20% drop he ascribes to the fact that ‘the gratuitous distribution of anti-toxin was commenced in June, 1897’. He does concede that the school children were on vacation, with school vaccination programs suspended, might have had anything to do with it.
FIGURE 7
Diptheria and Anti-toxin in Leicester, England

Diptheria in Leicester, England – cases and deaths
Note how sharply the death rate rose after antitoxin was introduced in 1895, from an average of 62 per year for the previous 57 years to a high of 1,514 deaths in 1900.
While the diphtheria epidemic started in England in 1893, it did not reach Birmingham or Leicester until 1895, and the records show that anti-toxin was introduced into Leicester in 1895.
As the five-year periods did not bring out the great increase in diphtheria that followed the introduction of anti-toxin, and the corresponding reduction that occurred when the Exemption Laws were invoked for protection, I have charted these ten years individually. The group figures are in all cases yearly averages, hence comparable with the epidemic figures.
Note that here also diphtheria still has a higher death rate than that which prevailed for the 60 years before anti-toxin was introduced. Also, note how the curve of this epidemic follows the activities of the pus-squirters. Its rise and fall probably indicates fairly well the true effect of anti-toxin in many places where the figures are not published by the ‘physicians’ who know them. And it is still going on.
In 1935 Dr C. Millard, the Medical Officer of Health for Leicester, made a report on Inoculation Against Diphtheria to the Health Committee of the City Council in which he advised against ‘any action … encouraging inoculation of the general public’.
He notes rises in the death rate in Birmingham and other towns after a large number of inoculations, and expresses the belief that ‘much diphtheria is spread by carriers’ and that inoculation is ‘definitely increasing the numbers of carriers’.
He also quoted from a report of the Medical Research Council to the effect that inoculation seems to increase the death rate in many cases.
This report indicates that statistics gave no evidence of improvement from inoculation in large scale diphtheria rates for total populations up to 1929. It says:
“In France, the most inoculated country in Europe, the incidence of diphtheria continued to rise steadily from 1924 to 1930… Craster (1931) relates that in 1921 an anti-diphtheria campaign was started in Newark, but was confined to the schools. At first, the result appeared promising, but in 1926 morbidity and fatality started to rise, and in 1929 Newark reported the highest diphtheria mortality in the United States for that year. It was noticed that the brunt of the disease was borne by the uninoculated children. Craster remarks: ‘I am confident that this occurred as the result of a general carrier condition among the immunized group in the home.’” (p.105)
This ‘confidence’ that pre-school age children died at such a high rate while the inoculated school children go entirely free sounds fishy to me. I think it is a case of misplaced confidence. It seems impossible for some doctors to doubt the germ theory.
Dr Millard mentions a reference to an increase in case fatality in Kansas from 4.9% in 1920 to 7.3% in 1929 and says
“Kinnaman (the State epidemiologist) believes that active immunization may actually increase the virulence of diphtheria bacilli”
and quotes the report as follows:
“Immunized carriers pass organisms of the more virulent type to non-immunized children, with the result that the fatality rate is increasing each year among non-immunized children who contract diphtheria.”
He also quotes the report to the effect that Detroit started a campaign in 1921, inoculating 3,000 a year for four years. In 1925 the yearly number was increased to 18,000 and in 1926 to 100,000. In this year there was:
“… a sudden rise in the attack and death rates of diphtheria. During the five years ending with 1930, the mean diphtheria death rate in much-inoculated Detroit was higher than that recorded in any other city in the United States.”
Dr Millard noted also that mortality from diphtheria for 1929 was 16.0 per 100,000 population, nearly four times the average of 4.1 for the last five years (1930–34) in Leicester, with no inoculations.
This sounds very much like what Dr J. W. Browne called ‘stirring up the embers and kindling the fire’ of tuberculosis.
Can you account for these increases with any other reasoning?
Dr W. Kellogg, director of the Bureau of Communicable Diseases, California State Board of Health, says the Schick Test should be abandoned completely. He adds:
“The percentage of errors in reading reactions in those who are protein-sensitive is frequently as high as 50%, even in the hands of the most experienced.”
What use is a test that is 50% wrong?
Dr J. Kilpatrick said before the Chicago Homeopathic Medical Society, December 4, 1928:
“I have never seen a person with a clean tongue and pure breath, who would take diptheria on exposure to it.”
FIGURE 8
Diptheria and Anti-toxin in certain U.S. Cities
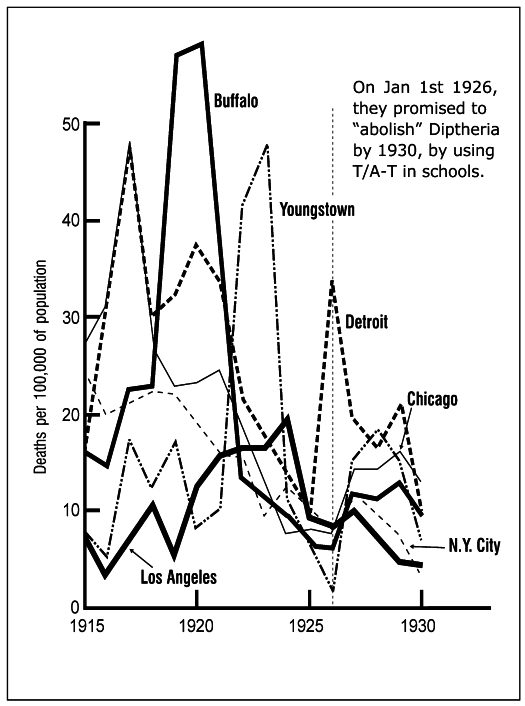
Deaths and use of toxin/antitoxin in city schools in the USA.
Note that the death rate declined until 1925, followed by a sharp rise in 1926/1927 in all cases, after the drive to sell anti-toxin started.
On January 1, 1926, the ‘A.M.A-ites’ started a drive to abolish diphtheria by 1930 by injecting Toxin Anti-toxin (T.A.T.) into all school children in the country, and, of course, they started on the large cities where they had large health departments and many school doctors and nurses to push the sale of the pus. The figures when charted do not indicate that diphtheria has been abolished, nor does it seem likely to be! On the contrary, most of the larger cities had an increase for the years following 1925 that probably will average more that 100% above the 1925 figures.
This chart only includes a few cities in which the drive was particularly noticeable, and in which, if T.A.T. had any beneficial effects, a marked reduction in diphtheria should have occurred.
Yet 1930 is past, and diphtheria, instead of being abolished, is worst where T.A.T. was pushed the hardest!
The figures for 1915 to 1924 are taken from the 1924 volume of Mortality Statistics of the United States Census Bureau, while those for 1925 to 1928 are based upon the total deaths in the later volumes. The populations were estimated from the 1920 and 1930 figures by subtracting one-tenth of their difference from the latter figures, for each year prior to 1930. And as this would not be strictly accurate, no attempt was made to adjust the figures to July 1st populations, as is usual in figuring death rates. The 1923 figure for Detroit is estimated in the same way as it is omitted from the table.
The figures for 1929 and 1930 are deduced from a table in the 1925–30 report of the Chicago Health Department in the same way. These years are therefore not exact but should still be reasonably close to the true figures. The Youngstown figures for 1929 and 1930 were furnished by Mr J. Flood of Pittsburgh, Pa.
Note that this chart shows a very substantial trend downwards from 1915 to 1925 or 1926, when this big drive started, but following these two years there was a sharp increase which covered the years 1927–29 when the T.A.T. was most widely used.
I don’t know whether the drop in 1930 was due to a let-up in the drive, or to hard times reducing the amount of food eaten by the public, which might improve the average health as it did in Holland during the war, or to a drop in the use of serums. However, I do not believe this drop was due to anti-toxin, nor do I believe that anti-toxin or any other biological will ever be of any assistance whatever.
This chart was made in 1931, and in trying to add to it recently I failed to find later figures for these cities; possibly the allopaths would like to keep them out of circulation.
A Real Cure
In 1879, before anti-toxin was discovered, Dr J. Kellogg of Battle Creek wrote a book on diphtheria in which he deplored death rates of 40% to 75%, which he said had occurred in many places at that time, and recommended an eliminative treatment with which he claimed to have had no deaths in treating over 400 cases.
As the case mortality rates in Chicago and many other cities have been between 8% and 10% in recent years, it seems to me that Dr Kellogg’s methods would be a great improvement over any biologicals.
The evidence offered here should satisfy anyone that the use of animal pus to heal the sick is one of the greatest debacles in the history of mankind.
END